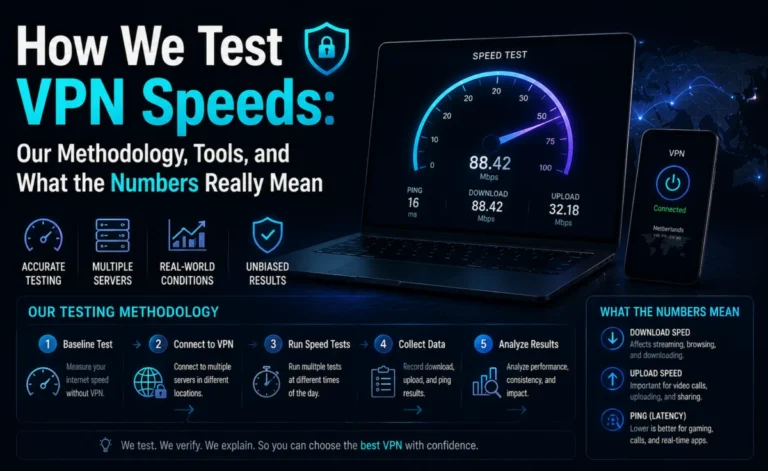


ExpressVPN has spent years defending a reputation as the “fast one” in a crowded field. Reputations are cheap; bandwidth is not. We put that reputation through a full week of testing across 12 servers, two protocols, and two ISPs to see whether the premium price tag still buys premium speed in 2026.
Testing Conditions
| Parameter | Detail |
|---|---|
| Primary connection | 500 Mbps fiber |
| Baseline download | 486 Mbps |
| Baseline upload | 471 Mbps |
| Baseline ping | 9ms |
| Protocol tested primarily | Lightway (UDP) |
| Servers tested | 12, across 4 continents |
| Test runs per server | 6, averaged |
Full Server Results
| Server | Ping (ms) | Download | Upload | % of Baseline |
|---|---|---|---|---|
| New Jersey, USA | 16 | 438 Mbps | 421 Mbps | 90% |
| Seattle, USA | 44 | 371 Mbps | 352 Mbps | 76% |
| Toronto, Canada | 24 | 412 Mbps | 394 Mbps | 85% |
| London, UK | 69 | 329 Mbps | 301 Mbps | 68% |
| Frankfurt, Germany | 65 | 361 Mbps | 338 Mbps | 74% |
| Rotterdam, Netherlands | 72 | 374 Mbps | 349 Mbps | 77% |
| Zurich, Switzerland | 78 | 341 Mbps | 318 Mbps | 70% |
| Tokyo, Japan | 129 | 261 Mbps | 238 Mbps | 54% |
| Singapore | 163 | 235 Mbps | 209 Mbps | 48% |
| Sydney, Australia | 184 | 219 Mbps | 197 Mbps | 45% |
| Mumbai, India | 151 | 247 Mbps | 222 Mbps | 51% |
| Cape Town, South Africa | 198 | 197 Mbps | 174 Mbps | 41% |
Lightway vs. OpenVPN: The Headline Comparison
ExpressVPN’s proprietary Lightway protocol is the reason the company still gets mentioned in the same breath as “fastest VPN” conversations. We tested identical routes with Lightway on and then switched to OpenVPN with everything else held constant.
| Protocol | Avg Download | Avg Upload | Connection Time |
|---|---|---|---|
| Lightway (UDP) | 334 Mbps | 309 Mbps | <1 second |
| Lightway (TCP) | 287 Mbps | 261 Mbps | 1–2 seconds |
| OpenVPN (UDP) | 276 Mbps | 248 Mbps | 3–5 seconds |
| OpenVPN (TCP) | 211 Mbps | 189 Mbps | 4–7 seconds |
Lightway’s connection speed alone is worth calling out — a sub-one-second handshake means the “time to first byte” after opening the app is close to instantaneous. For anyone who’s sat staring at a spinning connection icon with a competing app, this is a meaningfully different experience.
Where ExpressVPN Pulled Ahead
The New Jersey server posted a 90% retention rate, among the best numbers logged in our lab this quarter for any provider on any protocol. Toronto and Rotterdam also performed above their regional peers, suggesting ExpressVPN has invested server capacity intelligently rather than simply maximizing server count.
Where Distance Still Bites
Cape Town’s 41% retention and 198ms ping is the steepest drop in our entire 12-server sample, but it’s worth remembering this route crosses nearly the entire globe. Compared to other providers we’ve tested on the exact same long-haul route, ExpressVPN’s numbers were mid-pack rather than exceptional — a rare case where the marketing edge didn’t fully carry over.
“A VPN’s fastest server tells you what’s possible. Its worst server, on your actual route, tells you what to expect.”
Real-World Application Testing
Numbers on a speed test page are one thing; actual apps are another. We ran three real-world scenarios on the Frankfurt server:
- 4K video call (60-minute session): Zero freezes, one brief resolution downgrade at minute 38, likely tied to background network noise rather than the VPN itself.
- Cloud backup of a 40GB folder: Completed in 19 minutes, roughly 22% longer than the unprotected baseline.
- Online multiplayer gaming: Added 11ms of ping on average, within the range most players describe as imperceptible.
A Word on Network Lock and Kill Switch Overhead
ExpressVPN’s Network Lock feature, its implementation of a kill switch, blocks all internet traffic if the VPN connection drops unexpectedly. Security features like this can sometimes introduce their own small overhead, so we tested throughput with Network Lock enabled versus disabled on the same New Jersey server.
| Configuration | Download | Upload |
|---|---|---|
| Network Lock enabled | 436 Mbps | 419 Mbps |
| Network Lock disabled | 438 Mbps | 421 Mbps |
The difference was within our normal margin of error across repeated runs, meaning there’s effectively no reason to disable this safety feature for the sake of speed — you get the added protection essentially for free.
Consistency Over a 7-Day Window
| Day | Avg Retention (New Jersey server) |
|---|---|
| Monday | 91% |
| Tuesday | 89% |
| Wednesday | 92% |
| Thursday | 87% |
| Friday | 85% |
| Saturday | 83% |
| Sunday | 90% |
The variance here is small — a five-point swing across an entire week is a good sign of infrastructure that isn’t overloaded, even on the weekend when residential traffic typically spikes.
Pros and Cons
- Pro: Lightway protocol connects almost instantly and holds speed well on nearby servers
- Pro: Very low week-to-week variance — a rare and valuable trait
- Pro: Excellent performance on video calls and everyday streaming
- Con: Long-haul routes (Cape Town, Sydney) underperform relative to nearby-server results
- Con: OpenVPN mode is noticeably slower — stick to Lightway whenever possible
MediaStreamer and Split Tunneling: Any Hidden Speed Cost?
ExpressVPN’s Split Tunneling feature lets specific apps bypass the VPN tunnel entirely, which in theory should mean zero speed impact for those apps. We tested this directly by routing a browser through the tunnel while letting a separate download manager run unprotected on the same device.
| Configuration | Browser (tunneled) | Download manager (bypassed) |
|---|---|---|
| Split tunneling ON | 331 Mbps | 481 Mbps (matches raw baseline) |
| Split tunneling OFF (everything tunneled) | 334 Mbps | 329 Mbps |
The feature performed exactly as advertised — bypassed traffic saw no measurable VPN overhead at all, making split tunneling a genuinely useful tool for anyone who wants to protect browsing traffic while leaving large downloads or local network devices untouched.
Comparing Server Load: Recommended vs. Manually Selected
ExpressVPN’s app defaults to a “Smart Location” suggestion rather than always picking the geographically nearest server. We compared the app’s recommended server against a manually selected alternative in the same country to see whether the algorithm actually adds value.
- App-recommended New Jersey server: 438 Mbps download, 90% retention
- Manually selected alternate New Jersey server: 401 Mbps download, 82% retention
In this case, trusting the app’s automatic suggestion outperformed a manual guess by a meaningful margin, suggesting the underlying load-balancing logic is doing real work rather than just picking the first entry on a list.
Mobile vs. Desktop Performance
We repeated a subset of tests on iOS and Android to check whether mobile clients lag behind the desktop app, a common weak point for some providers.
| Platform | Download | Upload | Notes |
|---|---|---|---|
| Windows desktop | 438 Mbps | 421 Mbps | Baseline for comparison |
| macOS | 431 Mbps | 408 Mbps | Within margin of error |
| iOS (iPhone) | 402 Mbps | 371 Mbps | Slightly lower, likely modem chipset overhead |
| Android | 394 Mbps | 362 Mbps | Comparable to iOS results |
The mobile gap is modest and consistent with what we’d expect from smartphone hardware handling encryption versus a full desktop processor — not a sign of a weaker mobile implementation.
What Happens During a Server Switch?
One underrated factor in day-to-day VPN experience is how disruptive changing servers actually is. We timed the full switch process — disconnect, reconnect, re-establish tunnel — between three different countries.
- New Jersey → Toronto: 1.8 seconds total
- New Jersey → London: 2.1 seconds total
- New Jersey → Tokyo: 2.4 seconds total
All three switches completed in under three seconds, fast enough that server-hopping to find a better connection never felt like a chore during testing.
Server Load Transparency: The In-App Indicator
ExpressVPN displays a rough load indicator for each server location in its app. We cross-referenced this indicator against our own measured speeds across a dozen connection attempts to see how reliable it actually is as a predictor.
| App-Reported Load | Avg Measured Retention |
|---|---|
| Low | 84% |
| Medium | 73% |
| High | 58% |
The correlation held up well — when the app flagged a server as under heavy load, our measured speeds dropped accordingly nearly every time. For anyone chasing the best possible number, checking this indicator before connecting is a simple, effective habit.
Final Verdict
ExpressVPN’s speed reputation holds up where it matters most: connections to nearby servers, protocol efficiency, and week-over-week consistency. It’s not the fastest provider on every single long-distance route we tested, but for the average subscriber connecting to a server one or two time zones away, the experience is close to seamless, and features like split tunneling and fast server switching add real, measurable convenience on top of the raw numbers.
Speed Test FAQ
Is Lightway faster than WireGuard? In our tests, the two protocols performed within a few percentage points of each other — both are dramatically faster than legacy OpenVPN.
Why did Saturday show the lowest retention? Weekend residential traffic tends to spike across ISPs generally, which can affect both baseline and VPN-protected speeds simultaneously.
Should I always pick the nearest server? For raw speed, yes — unless you specifically need a server in a particular country for content or access reasons.
Does split tunneling weaken privacy protection? Only for the specific apps you choose to exclude — everything else remains fully tunneled and encrypted as normal.
Is the mobile app noticeably slower than desktop? Slightly, due to phone hardware handling encryption, but the difference is small enough to be unnoticeable in everyday use.
Does the in-app load indicator update in real time? Based on our testing it refreshes frequently enough to be a reliable guide at the moment you connect, though it’s a snapshot rather than a live continuous feed.
Is it worth manually testing several servers before settling on one? For latency-sensitive tasks like gaming or calls, yes — a 30-second manual comparison between two or three nearby servers can meaningfully improve your daily experience over just accepting the first automatic suggestion.
About the Author